Setting the scene: discourse trends across governance, policy, and institutional shifts
Between 2010 and 2019 there were several changes of government in Australia (Fig. 1). In 2014, Australia’s development agency of 40 years, AusAID, was absorbed into the Department of Foreign Affairs and Trade (DFAT). This unanticipated merger took place two months after the election of the Abbott Liberal-National (LNP) government, ostensibly to allow ‘the aid and diplomatic arms of Australia’s international policy agenda to be more closely aligned’38. The jobs of 500 DFAT and AusAID workers were targeted for redundancy or attrition39 with a loss of institutional knowledge that included loss of climate expertise40. Similarly, the Office of Development Effectiveness (ODE) was abolished in 2020, and replaced by a smaller dedicated internal department focused on project-level rather than larger strategic evaluations41,42.
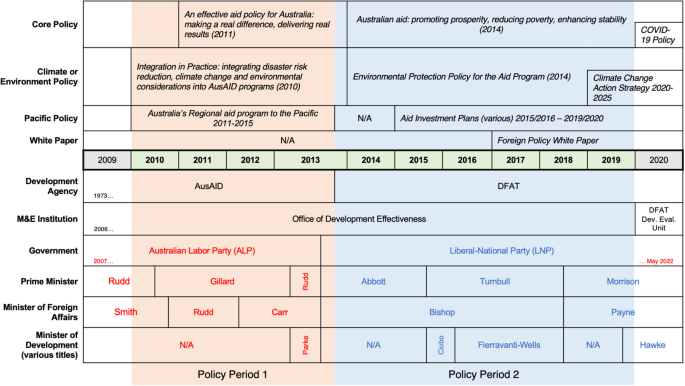
Note: M&E: monitoring and evaluation; Dev. Eval.: Development Evaluation. In order, Prime Ministers were Kevin Rudd, Julia Gillard, Kevin Rudd, Tony Abbott, Malcolm Turnbull, and Scott Morrison; Ministers for Foreign Affairs were Stephen Smith, Kevin Rudd, Bob Carr, Julie Bishop, and Marise Payne; Ministers of Development (and the Pacific) were Melissa Parke, Steven Ciobbo, Concetta Fierravanti-Wells, and Alex Hawke. Policies are dated by date of publication to track discourse at time of publication. Source: Authors’ compilation.
Two overarching aid policies were released during, respectively, the Gilliard Labor and Abbott LNP periods, followed by a time-bound COVID-19 policy in the Morrison LNP period (2020) (Fig. 1). In addition to these ‘core’ policy documents, several climate-relevant policy and strategy documents were published: an integration policy (2010), an environmental protection policy (2014), and a Climate Change Action Strategy (CCAS) (2019) housed under the latter. The CCAS was developed following an apparent ‘renewed focus’ on climate change after the 2015 Paris Agreement, and an ODE climate evaluation recommending a strategy in 201840. The 2018 Development Assistance Committee (DAC) Peer Review of Australia also recommended mainstreaming and increasing climate and environmental ODA based on the absence of ‘a strategic approach to mainstreaming the environment and climate across the programme that is backed by sufficient capacity and resources, despite recognition that these issues are risks for security and prosperity in the Pacific’43. This was a backslide compared to the 2013 DAC Peer Review which had recommended continuing AusAID’s mainstreaming approach44.
Australia also published Pacific policy documents, including an AusAID regional policy for 2011–2015. In 2015 and 2016, a variety of Aid Investment Plans (AIPs) up to 2019 or 2020 for regional and bilateral PICs programs were published. In addition, while there was no major policy update under the Turnbull LNP government, ‘Pacific Step-up’ language emerged with inter alia a funding announcement at the Pacific Islands Forum (PIF) in 2016 and release of the 2017 Foreign Policy White Paper45.
In broad strokes, Fig. 2 demonstrates reference to climate change in these key policies. The 2011 core policy integrated climate change as a key development objective46, while later policy made less or minimal reference to climate change (Panel a). Notably, the core policy introduced after the study period, Partnerships for Recovery (2020), mentions climate transiently on only five occasions, primarily in the context of security and stability, and does not refer to climate finance or the 2019 CCAS.
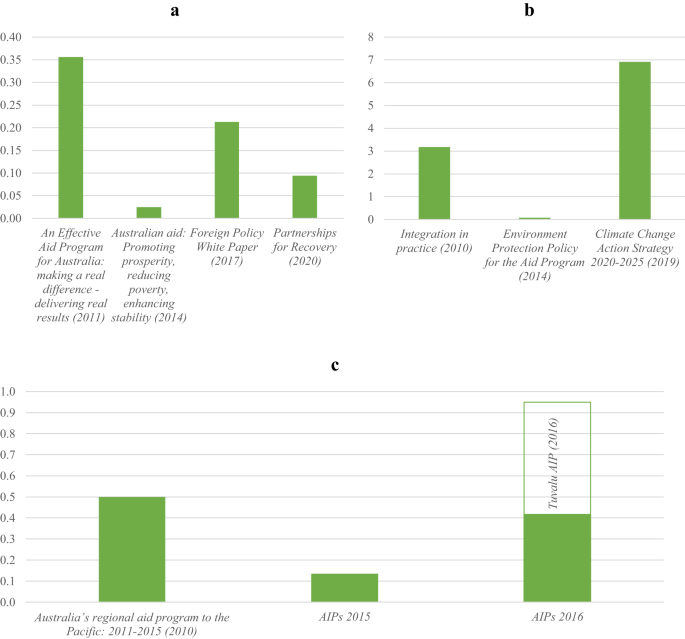
Note: a Incidence per page of “climate change” in core policy documents. b Incidence per page of “climate change” in environmental policy and strategy. c Incidence per page of “climate change” in Pacific policy and strategy. AIP: Aid Investment Plan. 2015 AIPs: PNG, Timor Leste, Solomon Islands, Samoa, Pacific Regional, Nauru, Kiribati, Fiji, Vanuatu, Tonga; 2016 AIPs: RMI, Tuvalu, Palau, FSM. Substantiveness varied from four pages long (FSM, Kiribati, Nauru, Palau, Samoa, and RMI) to 21 pages (PNG). Source: Authors’ compilation based on analysis of policy document corpus.
The most striking result of the above is the abrupt absence of “climate change” in the policies introduced in 2014 (panels a and b). “Climate change” is mentioned only once in each: in the 2014 core policy linked to natural disaster (p. 24) (panel a), and in the 2014 Environment Protection Policy, when describing the UNFCCC as a multilateral environmental agreement (MEA) amongst others of “relevance to the environment in Australia’s aid program” (p. 10) (panel b). Signature of relevant MEAs is listed as a policy justification (p. 2) but finance obligations are not mentioned. Related ‘good practice notes’ were also published with limited mention of climate change in four of 15 documents47 and no good practice note dedicated to climate change.
In Pacific policy, Tuvalu’s AIP is a major outlier, with 14 references to “climate change” (panel c). There were seven references to “climate change” in the 2010 regional policy, which dropped to an average of two references per document, or one if Tuvalu is excluded, in the subsequent Pacific AIPs. The Regional AIP (2015–2016 to 2018–2019) mentions “climate change” only once, though other relevant references to “climate” were made in the context of resilience (p. 7) and improving access to the Green Climate Fund (p. 7, 8, 12), which Australia ceased funding in 201848.
These trends are broadly mirrored over the whole corpus (Fig. 3). Of the 187 documents examined, 148 have at least one reference to “climate change”, and 172 to “Pacific”. Incidence of “climate change” changed considerably over time, with a large drop in 2014, to a low of only three per document mentions on average in 2015. Interestingly, while broadly incidence does not change if climate documents are excluded, there is a slight dip in 2010, and in 2019 the trend is considerably different. The CCAS was the only climate document released that year. If it is excluded, mentions of “climate change” trend downward, speaking to a lack of climate mainstreaming across the larger corpus.
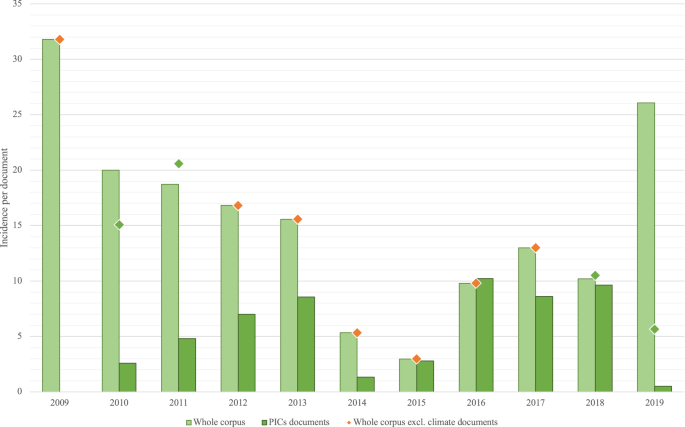
Note: Green markers indicate years with climate documents (2010, 2011, 2018, 2019). Source: Authors’ compilation based on analysis of policy document corpus.
Over the period, 101 corpus documents were dedicated to PICs. Up to 2013, discourse on climate change in PICs documents was expanding, follow by a dip in 2014 and 2015, and an abrupt increase in 2016 (Fig. 3). In 2019, almost no reference was made to “climate change” in PICs documents (primarily Aid Program Progress Reports (APPRs)), although documents of the same type contained several references in previous years.
This timeline demonstrates three key trends: a major dip in climate discourse after the 2014 change of government and disbanding of AusAID, including in environmental policy; growing and then inconsistent references to climate change in PICs documents; and the abrupt drop in 2019 across all documents except the CCAS. For PICs, not only the type but indeed the incidence of climate rhetoric in Australia’s development policy can provide an indication of Australia’s approach. It also provides us with useful context to compare with Australia’s development finance disbursements, and our climate justice criteria.
Adequacy, additionality, and predictability
We begin with a focus on the adequacy and additionality of Australia’s climate-related Official Development Finance (CODF). We consider grants, the share of CODF in Australia’s development programme over time, and the provision of principal CODF. We then consider the predictability of Australia’s CODF by examining its consistency over time, and its CODF relative to discourse in its Aid Investment Plans.
Between 2010 and 2019, Australia reported $30.75 billion in ODF. Of this amount, $3.8 billion (12%) was marked as climate finance, and $9.47 billion (31%) was directed at PICs. PICs received $1.25 billion in CODF, 33% of Australia’s CODF and 4% of its total ODF. All Australian CODF over the decade was in the form of grants.
At the start of the decade, Australia’s ODF was rising before declining after 2013 to a low of $2.19 billion in 2017 (Fig. 4). Similarly, while CODF almost doubled between 2010 and 2011 to $466 million, it did not exceed this height until 2019, at $568 million. CODF made up between 8 and 15% of Australia’s ODF between 2010 and 2018, jumping to 21% in 2019 (Supplementary Note 1).
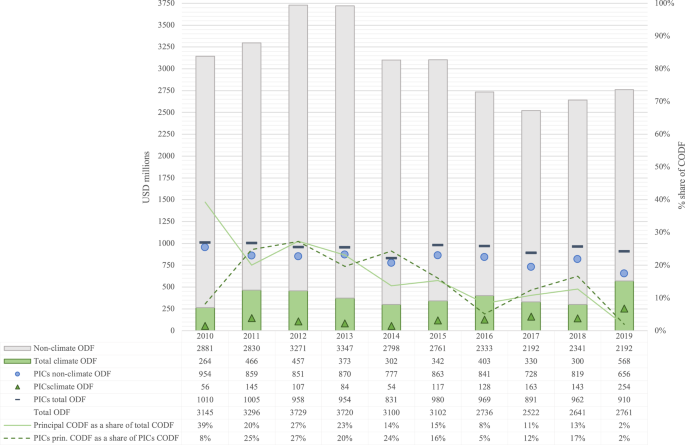
Note: Figures in USD millions. Source: Authors’ compilation based on OECD CRS data.
PICs’ share of total ODF stayed between 26–36% throughout the period. While Australia ostensibly reoriented its development program towards the Indo-Pacific49,50, overall ODF received by PICs did not expand in real terms. PICs’ share of CODF oscillated between 18 and 32% between 2010 and 2016, before rising abruptly to a height of 49% in 2017. Of the ODF received by PICs, only between 6 and 18% addressed climate change each year, until 2019, when this share jumped to 28%.
While there was an additional $304 million in yearly CODF provided in 2019 compared to 2010, yearly non-climate ODF declined by $689 million over the same period (Supplementary Note 2). This $384 million decline in ODF—and the fact that the uptick in CODF would need to more than double to break even on the reduction in non-climate ODF—indicates that the climate finance provided cannot be considered as additional to existing development finance. Similarly, there is a $100 million deficit in the case of PICs, with a $298 million reduction in non-climate ODF, compared to a $198 million increase in CODF.
Early in the decade, Australia indicated it was providing funding that ‘draws from a growing aid budget. It does not displace funding from existing aid programs’51; however, this discourse later vanished. The finance flow data, when disaggregated by policy period, confirms this pattern. Between 2010 and 2013, non-climate ODF increased by $466 million, and CODF by $109 million—climate finance thereby making up part of the ‘additional’ finance disbursed by Australia in that time, in line with its early claim. On the other hand, no references to additionality could be found in post-AusAID documents, and between 2014 and 2019, non-climate ODF decreased by $606 million, while CODF increased by $266 million— a deficit of $340 million.
At the same time, the share of CODF that was marked with a principal marker was low and diminishing, reaching only 2% in 2019 (from 39% in 2010). In PICs, the share also dropped to only 2%, from a high of 27% in 2012. In absolute terms, this represents a drop from $21.5 million to $14.7 million.
To some extent, CODF in the Pacific remained predictable—predictably low. Yet even so there were large year-to-year variations in CODF disbursements to Pacific recipients (see Fig. 5) undermining its predictability. This is also echoed in the discourse. Almost all multi-year Aid Investment Plans (AIPs) for PICs mentioned “climate change”, except for those of Papua New Guinea (PNG), Timor-Leste, and Samoa (Fig. 5). This is surprising, considering the growth in Australian CODF to PICs from 2015 onwards is largely explained by growth in CODF to PNG. All other AIPs mentioned the term between one and three times, except for that of Tuvalu, which mentioned it on 14 occasions. This is also surprising, as the AIP for Tuvalu was published in 2016, yet disbursements to Tuvalu fell after 2015, staying between $0.67–2 million, before jumping abruptly to $5.7 million in 2019 (Supplementary Note 3). In short, climate discourse in these AIPs is not a good indicator of climate finance disbursement. Data also shows that scaling up could not be expected for all recipients, given growth to the region overall is largely explained by growth to PNG. None of these metrics bode well for the predictability of Australia’s CODF over the study period.
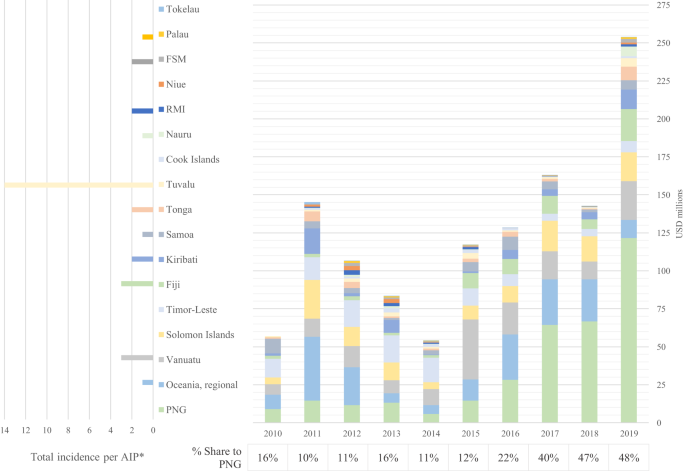
Note: *No Aid Investment Plans (AIPs) available for Tokelau, Niue, or Cook Islands. Source: Authors’ compilation based on OECD CRS data and analysis of policy document corpus.
Overall, we find that Australia’s provision of climate finance in grant form aligns with our justice criteria. Yet, Australia’s climate finance in total and to PICs cannot be considered additional to Australia’s development finance over the same period. Further, bearing in mind the challenges of quantifying CODF, we cannot consider the finance to be ‘adequate’ in that it was not substantially scaled up over time in line with commitments to do so. These conclusions are further intensified when examining the low and diminishing amount of this finance that demonstrates a principal objective, rather than an effort at mainstreaming (significant marker). In addition, PICs receipt and scaling up of CODF was variable (or absent), and while Australia provided multi-year investment plans for PICs, the climate discourse within them did not align well with CODF disbursements, undermining predictability.
‘Balanced’ adaptation and mitigation finance and focus on vulnerable countries
We now turn to the balance and distribution of Australia’s adaptation finance. Australia’s CODF was dominated by adaptation projects (Fig. 6), a net positive considering the domination of mitigation finance globally. Mitigation projects were a clear minority (only 6% of CODF was principal mitigation finance, and 7% significant), and increasingly targeted vulnerable countries: after 2014, all recipients of mitigation ODF were PICs, whereas earlier recipients also included large economies such as Indonesia, Brazil, and China.
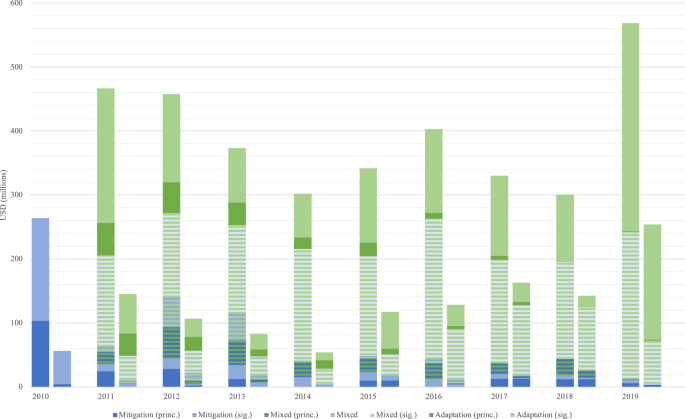
Note: Left columns are total CODF; right columns are CODF to PICs. Australia’s use of the adaptation marker commenced in 2011. Source: Authors’ compilation based on OECD CRS data.
For adaptation finance, only 5% was marked as principal adaptation-related ODF (AODF). The remainder was significant (34%), principal mixed (6%), mixed (3%), or significant mixed (39%). These categories are problematic because, firstly, no distinction is made between climate goals, and secondly, it is unclear what portion of the reported finance actually targets adaptation, as the whole value is attributed to the marker (as for all significant projects, reflecting the mainstreaming function of the Rio markers; see Methods). Similarly, duplicate marking with principal markers (principal mixed) risks double counting and should only take place ‘upon explicit justification’52. However, 36% of the 147 Australian projects marked in this manner, including the top eleven projects making up 67% of the value of all mixed principal projects, included no reference to the term ‘climate’ in their CRS long descriptions (based on authors’ manual review).
We now focus on the allocation of adaptation finance according to the vulnerability of recipients (Supplementary Note 4). While all SIDS are considered climate vulnerable, LDCs and atoll states are often considered most vulnerable. Overall, a large share of Australia’s AODF went to LDCs and SIDS (43%); however, in the Pacific, LDCs received a variable share of principal AODF—from 87% in 2015 to 3% only a year later. More significant AODF was provided, but overall receipt of funds was variable and still fell. Atolls consistently received less adaptation funding than LDCs, aligning with other research that indicates population size may be a better indicator of distribution than vulnerability22.
Next, Fig. 7 demonstrates the change in per capita receipt of AODF across policy periods, compared to climate discourse, and according to PICs’ vulnerability as measured by the Universal Vulnerability Index (UVI)34. Firstly, discourse is not consistent with the vulnerability of recipients—while documents for Kiribati, with the highest vulnerability score, had the highest number of references to adaptation, PNG, the least vulnerable, had the most references to climate change besides the regional documentation (not pictured). Meanwhile, Palau and Marshall Islands, amongst the most vulnerable, had hardly any references to either. There was minimal vulnerability discourse overall.
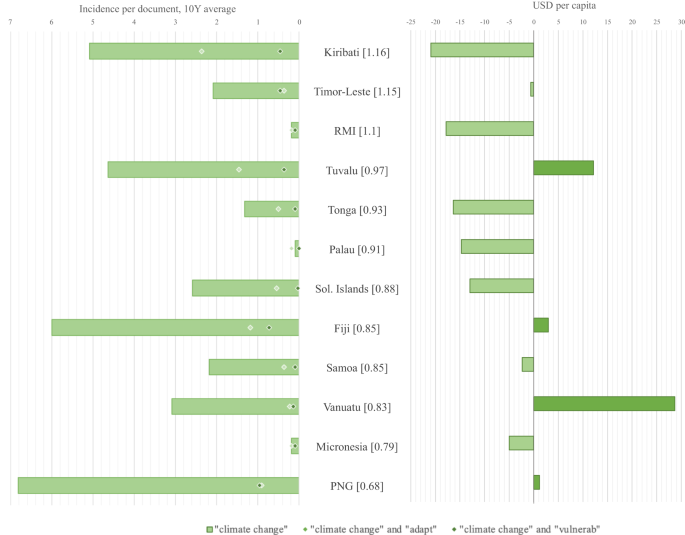
Note: UVI scores unavailable for Cook Islands, Nauru, Niue, Tokelau, and Wallis and Futuna; accordingly, not pictured: Tokelau and Niue had the largest reduction of $435 and $1094 per capita respectively. Nauru was the only other recipient to receive an increase, of $17 per capita. AODF data begins in 2011 when Australia’s use of the adaptation marker began. Higher UVI indicates higher vulnerability. Source: Authors’ compilation based on OECD CRS, analysis of policy document corpus, and Commonwealth Universal Vulnerability Index (UVI) scores34.
At the same time, only five PICs saw their average adaptation finance per capita grow over the different policy periods: Fiji, Nauru (not pictured), PNG, Tuvalu, and Vanuatu. The majority of Pacific recipients saw their average per capita AODF decline, including some of the most vulnerable. Not pictured are Tokelau and Niue, which had the largest reductions of $435 and $1094 per capita, respectively. In short, despite the domination of adaptation finance in Australia’s programme, AODF receipt and scaling up have not been distributed evenly across recipients or according to recipient vulnerability, even when accounting for population size.
Finally, comparing the two datasets, we see no clear pattern across discourse and finance, with relative receipt or incidence demonstrating no clear connection. For example, the relatively high incidence of climate/adaptation discourse directed at vulnerable Kiribati did not correspond with increased receipt of this type of finance, while a similar pattern of incidence for Tuvalu did. In short, climate/adaptation discourse was again not a good indicator of receipt.
Donor coordination and fair share
The COP15 goal of $100 billion in climate finance to be provided by industrialised countries by 2020 is collective. We hence evaluate to what extent Australia’s CODF represents its fair share, in simple % of GNI terms, as well as how well it can be seen to coordinate with other donors in the Pacific.
While Australia had an early, though never attained, 0.5% ODA/GNI target46, it has never had a % GNI target for its climate finance. Its CODF stayed between 0.02% and 0.04% of GNI over the study period, while the DAC average grew from 0.04% to 0.08% of GNI—both are below what different studies suggest as targets31,53, including the lowest target set for Australia amongst studies reviewed, of 0.1% of GNI29.
At the same time, just collective provision of climate finance could reasonably result in some donors providing more or less than others, to varying recipients through varying funding models, according to relative capacity, responsibility, or comparative advantage in development programming. We here have chosen a demonstrative example we consider relevant to the just provision of climate finance in the Pacific: the collective provision of principal AODF to PICs. In 2010, Australia’s core policy notably mentioned that the increase in donors and climate finance, especially for adaptation, after Copenhagen could represent a ‘key risk to the quality and value of regional activities’ through ‘proliferation and fragmentation’51. However, as Fig. 8 demonstrates, any prospective attempts to address this challenge have not translated into growing—or even consistent—receipt of principal adaption finance for PICs from the DAC as a collective.
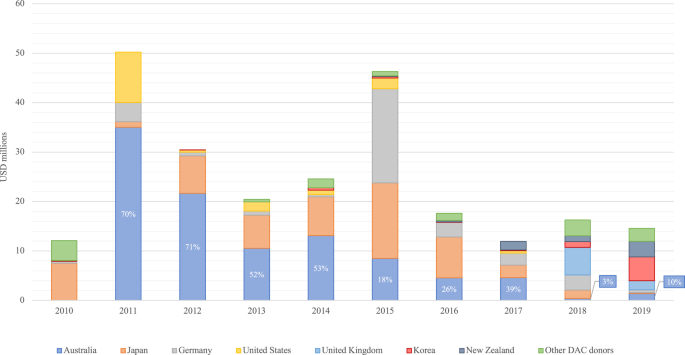
Note: Several donors, including Australia, only used the adaptation marker from 2011 onwards. Source: Authors’ compilation based on OECD CRS data.
Indeed, DAC principal AODF to PICs fell considerably over time, with Australia’s share falling from 70% in 2011 to its lowest point of 3% in 2018. Overall, this not only demonstrates a lack of donor coordination, it also clashes with the idea of climate/adaptation finance being scaled up over time, additional, adequate, or targeted to vulnerable recipients. It also precludes the dramatic reduction in principal adaptation finance on the part of Australia being explained by increased provision by other donors.
To what extent does Australia’s climate-related development finance in the Pacific meet criteria of climate justice?
We argued that for climate finance to contribute to climate justice, it needs to (i) be adequate, additional, and predictable, as well as (ii) prioritise adaptation for vulnerable recipients, mainly through grants. We also expect (iii) donors to provide their fair share towards the collective goal, and coordinate finance flows. We evaluated Australia’s approach to climate change in its development programme in the Pacific against these criteria, relying on both its policy discourse and climate finance flows.
We found that Australia’s climate finance has not been additional over time. Certainly, it was provided in grant form (as was the vast majority of Australia’s ODF)—fulfilling the international commitment to do so for adaptation. However, while CODF during the initial AusAID policy period (2010–2013) was additional to existing development finance, in the long term this trend ceased. Not only was CODF not sufficiently scaled up, overall ODF shrank over the decade. Even in the Pacific, a nominal consolidation and reorientation of the development programme towards the region, while seeing an expansion of the CODF provided, has not been accompanied by the disbursement of ‘additional’ CODF. Similarly, the share of principal CODF was so low, and shrank so considerably over time, that if this standard of additionality is applied, Australia’s performance was critically inadequate and diminishing.
Australia’s climate finance was also not consistently predictable. It maintained its Pacific CODF flows, though this provision was variable over time amongst recipients, with latter-year growth principally explained by significant finance and disbursements to PNG. In addition, while Australia prepared several multi-year investment plans for the Pacific, discursive patterns showed that these plans were not a good predictor of the CODF PICs could expect to be disbursed. This kind of discursive inconsistency is reflective of the same found in core policies, and of the clear disruption that the 2014 governance/policy/institutional shift appears to have provoked for not only the programme overall, but for the situation of climate change within it, suggesting that climate finance predictability may be impacted by donor political shifts or governance modalities.
Australia’s CODF fares somewhat better on our second criterion, with a relatively strong though diminishing focus on adaptation throughout the study period, as it shifted from principal to significant financing. In the meantime, while AODF was generally concentrated on SIDS and LDCs as a group, atolls received no special treatment. In addition, targeting at the recipient level could not be explained by relative vulnerability as determined by a vulnerability index, even when accounting for population size, demonstrating that the use of SIDS and LDCs as aggregate groups to measure the justness of climate finance may mask underlying distributional inequalities. Herein, the Pacific case was a particularly good demonstrator—for example, growth in CODF receipt by PNG influenced the apparent growth in aggregate PICs receipt; however, it was not accompanied by growth for other PICs, and indeed corresponded with a per capita drop in AODF for many, including many whose relative vulnerability was higher. Similarly, the discrepancies in climate discourse across PICs recipients and between these recipients and their CODF receipt suggest that climate discourse was not a good indicator of receipt, and similarly, discursive treatment of the Pacific as a collective may be misleading in terms of the actual distribution of climate finance.
Finally, in addition to Australia not providing its fair share over time according to its capability (% of GNI), there was also a major challenge of donor coordination in the Pacific, with Australia’s initial leadership on principal adaptation finance diminishing rapidly, without any substitution by other donors. This is particularly challenging in view of the discord between considerable and growing adaptation needs in the Pacific and the actual support provided to adaptation in the region54. Beyond misalignment with the requirement to provide adaptation finance to SIDS, this reflects a broader disconnect between donors and the plight of SIDS, as well as with their own assertions; as early as 2006, development finance providers were formally acknowledging the need for adaptation finance in SIDS in the DAC context55.
In short, from a justice perspective, Australia has approached climate change inconsistently and at times incoherently across its development program and in Pacific SIDS, and in a manner that has diminished its position over time. With a new government and renewed focus on climate change and development, however, there is room to improve its development programme and engage climate finance as a mechanism for climate justice in the Pacific, building on new announcements to scale up climate finance to the region56.
Moving forward, there is a need to better balance the provision of just climate finance (in line with international commitments) with climate mainstreaming (as good development practice) in the development program. In our results, the lack of consistent mainstreaming of climate discourse, with its notable absence in 2014 core and environmental policy as well as in 2019 when the CCAS was excluded from the corpus, undermined the idea that climate mainstreaming could explain the recourse to significant markers in later CRS reporting. This aligns with mainstreaming criticism levelled in evaluations by ODE40 and OECD43. In addition to actual good practice, this suggests the basic need to reintegrate climate change into Australia’s development policy and align its CRS reporting accordingly. Our climate justice results, which generally demonstrated better outcomes in the early mainstreaming era, suggest this could also contribute to positive climate justice outcomes for Australia’s climate related development finance.